- About
- News
- Services
-
Maps
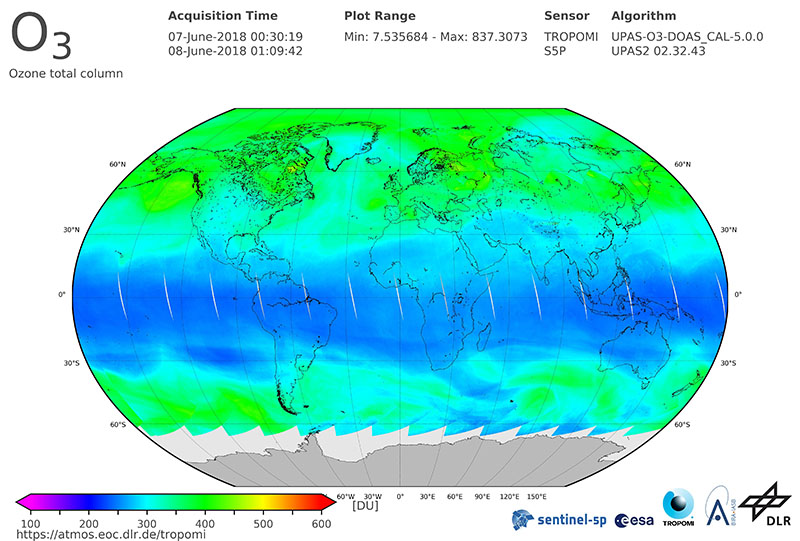
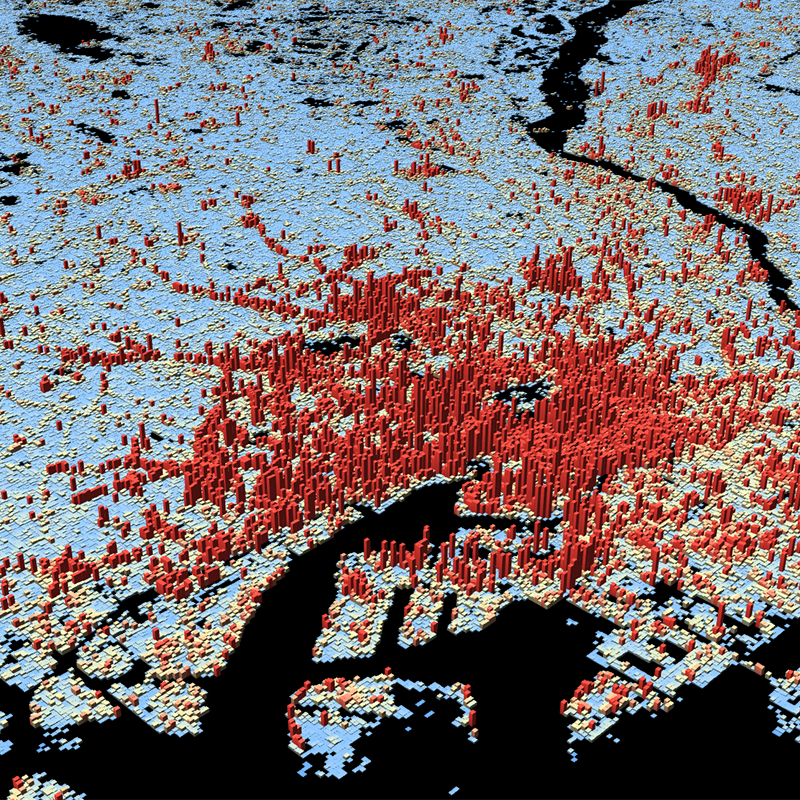
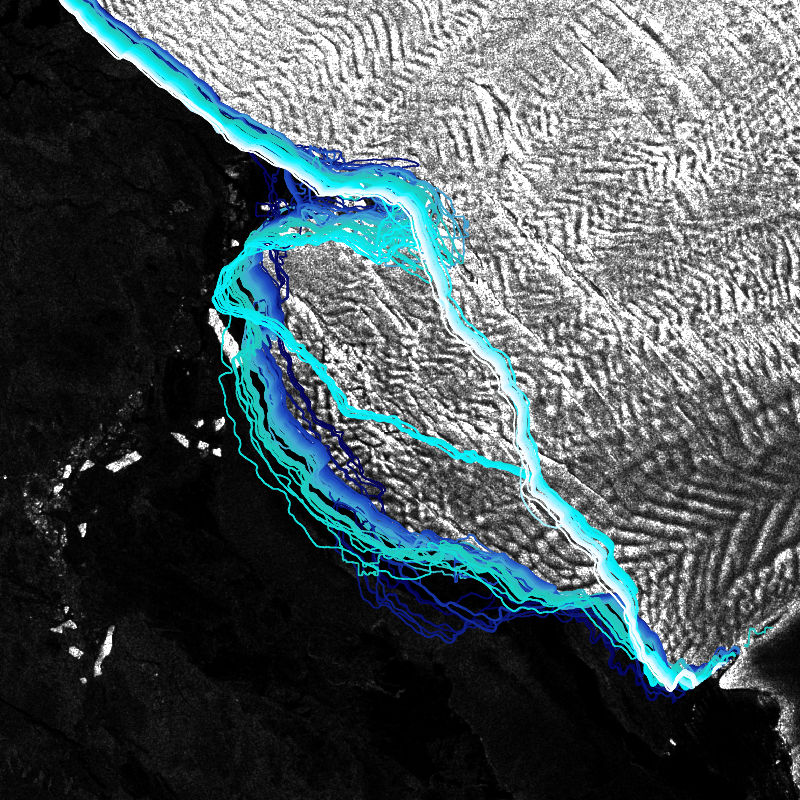
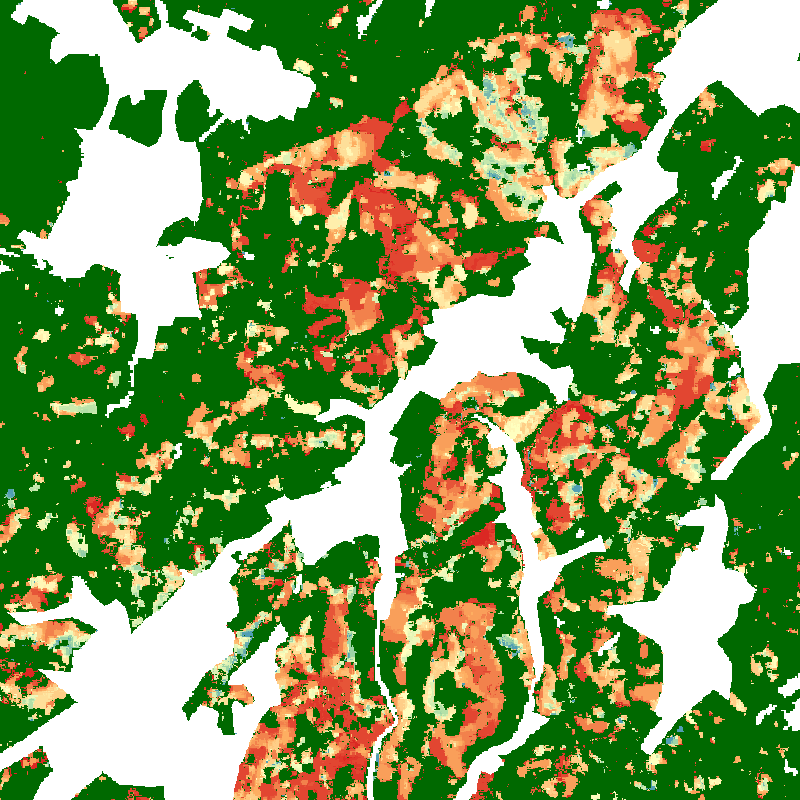
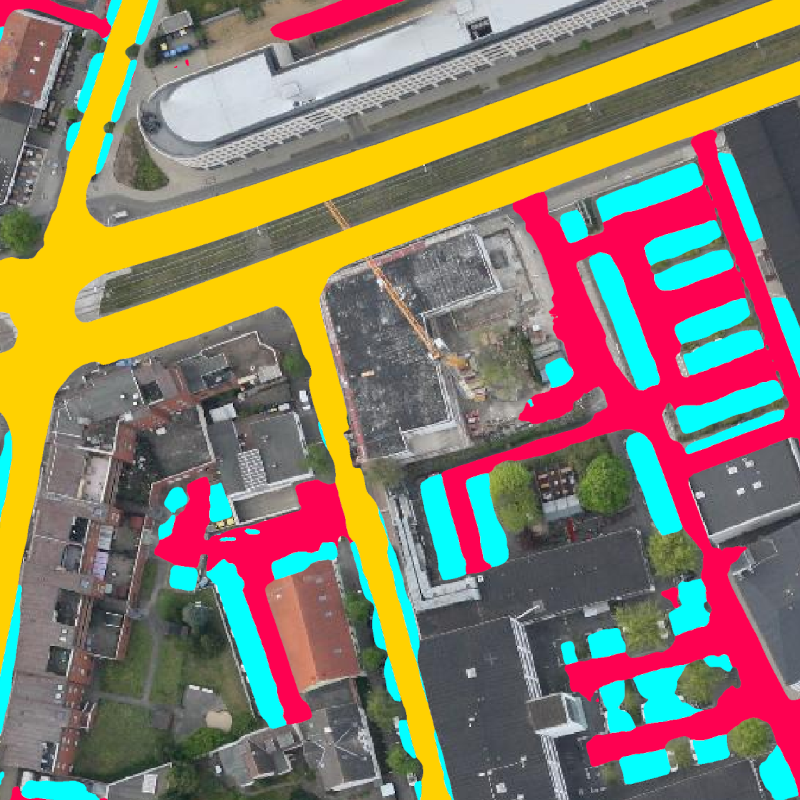
TanDEM-X 30m Edited Digital Elevation Model (EDEM) TanDEM-X 30m DEM Change Maps (DCM) TanDEM-X 90m DEM TanDEM-X PolarDEM 90m of Antarctica TanDEM-X Forest/Non-Forest Map SRTM X-SAR DEM EnMAP L0 Quicklooks Burnt Area Daily NRT Incremental Product - Europe, MODIS Burnt Area Daily NRT Incremental Product - Europe, Sentinel-3 Burnt Area Monthly Composite - Europe, Sentinel-3 Burnt Area Yearly Composite - Europe, Sentinel-3 MetOp GOME-2 Daily Total Column Composites Sentinel-5P TROPOMI L3 Daily Composites Sentinel-5P TROPOMI L4-DE Daily Composites MODIS-EU Daily Mosaic MODIS-DE Mosaic Sentinel-2 L2A MAJA Products Sentinel-2 L3A WASP Products World Settlement Footprint (WSF) - Landsat-8/Sentinel-1 - Global, 2015 World Settlement Footprint (WSF) - Sentinel-1/Sentinel-2 - Global, 2019 World Settlement Footprint (WSF) Evolution World Settlement Footprint (WSF) 3D - Global, 90m GUF® - Global Urban Footprint® v1 - EPSG:3857 (WGS 84 / Pseudo-Mercator) GUF® - Global Urban Footprint® v1 - EPSG:4326 (WGS84 / geocentric) GWP - Global WaterPack Yearly GWP - Global WaterPack Monthly GSP - Global SnowPack Yearly GSP - Global SnowPack Daily GSP - Global SnowPack Mean TimeScan Landsat 2015 Forest Structure - Germany, 2017-2022 AVHRR - Monthly Sea Surface Temperature IceLines - Ice Shelf and Glacier Front Time Series CORINE Land Cover Land Cover DE Tree Canopy Cover Loss - Germany, 2018-2021 RapidEye RESA - L3M Mosaic - Germany S-VELD S5P Trop. NO2 Columns (Daily/Orbit) S-VELD S5P Trop. NO2 Columns (Monthly Mean) S-VELD S5P Surface NO2 (Daily/Orbit) S-VELD S5P Surface NO2 (Monthly Mean) S-VELD MODIS/SLSTR Surface PM2.5 (Monthly Mean) Soil Composite Mapping Processor (SCMaP) Products (5 years) Soil Composite Mapping Processor (SCMaP) Products (30 years) UrMo Digital - Traffic Area Map (TAM) - Brunswick, Germany Geo-ForPy - Forest cover Paraguayan Chaco Residential Heat Demand - Baden Württemberg, Germany ECoLaSS - Evolution of Copernicus Land Services based on Sentinel Data fCover - Fractional Vegetation Cover Netherlands based on Sentinel-2 Data
-
Downloads
EnMAP fCover Sentinel-2 Netherlands Forest Structure Germany Geo-ForPy - Forest Cover Paraguayan Chaco GWP - Global WaterPack GSP - Global SnowPack IceLines - Ice Shelf and Glacier Front Time Series Land Cover DE Sentinel-2 L2A MAJA Sentinel-2 L3A WASP Sentinel-5p Tropomi S-VELD NO2 and PM2.5 SRTM X-SAR DEM TanDEM-X 30m Edited Digital Elevation Model (EDEM) TanDEM-X 30m DEM Change Maps (DCM) TanDEM-X 90m DEM TanDEM-X Forest/Non-Forest Map TanDEM-X PolarDEM Antarctica TerraSAR-X Supersites Tree Canopy Cover Loss - Germany, 2018-2021 UrMo Digital - Traffic Area Map (TAM) - Brunswick, Germany World Settlement Footprint 2015 World Settlement Footprint 2019 World Settlement Footprint Evolution World Settlement Footprint 3D
- Data Guides